ECB Environmental Statement 2025

2024 marked a significant milestone as the European Central Bank (ECB) concluded its first environmental management cycle after aligning its emission reduction goals with the ambitious 1.5 degrees Celsius target set out in the Paris Agreement.
As we navigated the resurgence of carbon-intensive activities following the pandemic, in 2023 and 2024, our focus was on mitigating the effects of this rebound. Despite these challenges, we maintained a steady environmental performance, particularly in terms of carbon emissions, illustrating our dedication to decarbonising operations and continuous improvement efforts.
The urgency of our mission is underscored by the fact that 2024 marked the hottest year ever recorded, with temperatures at around 1.55 degrees Celsius above pre-industrial levels. This pivotal moment highlights the critical importance of the fight against climate change.
As an institution, we strengthened our climate commitments for 2025-2027 and beyond, supporting our Paris Agreement-aligned goal to reduce carbon emissions by 46.2% from 2019 levels by 2030. We have incorporated new measures into our updated Environmental Management Programme (EMP), focusing on the most significant actionable contributors to our carbon footprint, namely ECB staff business travel and conference participant travel. Compared with our 2019 baseline, we have made significant progress, achieving a 29% reduction in business travel-related emissions and a 62% reduction in conference-related emissions. However, further reductions are necessary to meet our 2030 target. Therefore, we continue to optimise travel arrangements and event organisation while maintaining significant reductions in electricity consumption across our premises.
In addition to stabilising emissions, we have established new goals and strategies in other key areas, such as energy, materials and waste, biodiversity, procurement and awareness raising. These initiatives include insight from the past three years and are designed to advance our long-term objectives. Our commitment extends to fostering behavioural changes to make our operations more environmentally sustainable.
Looking ahead, the path to a more sustainable world presents both challenges and opportunities. We remain steadfast in our determination to combat climate change and protect the environment, driven by a shared commitment to the EU’s environmental goals and building a sustainable future for generations to come.
The ECB Environmental Statement 2025 reaffirms our dedication to reducing our operational carbon footprint, while acknowledging the unprecedented challenges posed by climate change. In addition to making the ECB’s operations more sustainable, we are taking comprehensive/far-reaching steps to address climate change and environmental degradation. In 2024 we launched our Climate and nature plan 2024-2025, focusing on three key areas for climate and nature protection initiatives. Thanks to the invaluable support of our colleagues across the ECB, we have made significant progress. Our commitment to transparency and accountability remains strong as we enhance our environmental reporting and engage with stakeholders throughout our value chain. The collaboration and dedication of ECB staff have been, and continue to be, crucial in driving positive change and encouraging broader action.
We invite everyone to join us in our efforts to tackle climate change and help create a more sustainable world.
Myriam Moufakkir
Chief Services Officer of the European Central Bank
Figure 1
2024 highlights

Source: ECB.
Despite increases in certain activities in 2024 compared with 2023, such as energy consumption, there were notable improvements in specific components of the carbon footprint. For instance, reductions in emissions from conference participants’ travel contributed to keeping in line with the target trajectory.[2]
The Eurosystem, the central banking framework of the euro area, comprises the ECB and the national central banks (NCBs) of the member countries. Its primary mandate is to ensure price stability. In addition, through the Single Supervisory Mechanism, the ECB is responsible for the prudential oversight of credit institutions within the euro area and other participating nations. This task is carried out in close collaboration with the relevant national supervisory authorities.
The ECB outlines the responsibilities and actions within its mandate through its Annual Report and in the yearly report on its supervisory activities. Since 2022 the Annual Report has included a chapter summarising all sustainability-related efforts.
This Environmental Statement focuses on the ECB’s organisational footprint – specifically, the environmental impact of its buildings and day-to-day operations, including the use of energy and materials, as well as travel-related emissions. It presents the ECB’s environmental performance in 2024 and highlights the key milestones and measures implemented to reduce its environmental impact as an institution.
Additional details about the ECB, its functions and its role within the European System of Central Banks (ESCB) and the Eurosystem can be found on the ECB’s official website.
2.1 ECB premises
This section describes the three buildings that are covered by the ECB’s Environmental Management System (EMS).[3]
Main building
The ECB’s main building, located in Frankfurt’s Ostend district, officially opened in November 2014. It accommodates most of the ECB’s workspaces.
Thanks to its sustainable design and construction, the building exceeds the standards of Germany’s 2007 Energy Saving Ordinance (“Energiesparverordnung”) by 29%. It features several noteworthy environmental elements:
- the facade of the high-rise tower is equipped with an energy-efficient triple layer;
- the facades and roof of the Grossmarkthalle are insulated to improve energy efficiency;
- natural ventilation is achieved through operable facade elements, electric sun shading and low-energy lighting, ensuring optimal working conditions with maximum daylight;
- other relevant features of the building include rainwater collection, which is used for irrigation and sanitary areas,[4] as well as geothermal energy, which is used to heat and cool the premises.[5]
The landscaping around the ECB’s main building contributes to Frankfurt’s “green lung” by connecting the institution’s grounds with adjacent urban parks and the city’s wider green belt. Guided by input from landscape and biodiversity specialists, the ECB’s Green Care team has implemented various measures to enhance biodiversity on the premises. These initiatives are further detailed in Chapter 6.6 – Biodiversity.
Additional information can be found on the ECB’s website in the section on the main building and its sustainability aspects.
City centre (Eurotower and Japan Center)
The Eurotower and the Japan Center are both situated in Frankfurt’s city centre and have been leased by the ECB since 1998 and 2014 respectively. Together, they accommodate nearly half of the ECB’s workspaces, primarily hosting banking supervision staff.
The Eurotower was awarded gold certification under the Leadership in Energy and Environmental Design programme in 2020. This recognition followed a series of technical upgrades carried out between 2015 and 2016, which included:
- installation of energy-efficient sun shading systems;
- insulation of the concrete core;
- installation of new combined heat and power plants;
- updating of air conditioning systems to improve energy efficiency;
- increased energy efficiency in lifts;
- an LED lighting system in the offices.
Further objectives and measures to enhance the energy efficiency of the ECB’s buildings are outlined in greater detail in Chapter 6.2 – Energy efficiency.
Changes to the set-up of the ECB’s premises are foreseen, as the ECB is vacating the Eurotower and moving to another office building in 2025.
3.1 Organisational context
2024 marked the ECB’s second full year of operations without pandemic-related restrictions. From 2020 to 2022, these restrictions had a considerable impact, significantly reducing business travel and constraining the presence of ECB staff at its premises. Following the lifting of restrictions and the return to full-scale operations in 2023, the ECB’s carbon footprint increased once again – particularly as a result of the rise in business travel emissions. In 2024 business travel-related emissions saw a slight increase of 5%, while conference participants’ travel-related emissions decreased by 6% compared with the previous year. These two emission sources will remain key focus areas as the ECB works towards further reducing its climate impact (see Chapter 5.2 – Indirect emissions).
Since the ECB is planning its relocation from the Eurotower to the Gallileo Tower in the city centre of Frankfurt in 2025, the related environmentally relevant activities will be considered and integrated into the EMS wherever applicable.
The future development of the ECB’s EMS will continue to be shaped by changes in the organisational context, including emerging opportunities and risks as well as evolving stakeholder expectations. Material risks, particularly physical and transition risks, that could affect internal business operations need to be assessed as part of the EMS annual processes.
In addition to its internal activities, the ECB addresses climate-related issues relevant to its mandate. It recognises that climate change and the degradation of nature pose significant risks to the economy and financial systems, which also affect the ECB. Identifying and addressing transition needs in these areas is essential for fulfilling its responsibilities. The ECB’s ongoing work in 2024 is detailed in its Annual Report and in the ECB Annual Report on supervisory activities. Since 2023 the ECB and Eurosystem NCBs have also published annual climate-related financial disclosures, covering the financial assets held in portfolios for monetary policy purposes. In January 2024 the ECB published its Climate and nature plan 2024-2025, reaffirming its commitment to climate action. This plan defines three focus areas for the period: supporting the green transition, assessing physical climate impacts and examining nature-related risks. The ECB’s EMS contributes to the broader climate and nature plan with its focus on reducing the environmental footprint of its own operations in an effort to foster wider action.
Climate-related disclosures are also provided by Eurosystem NCBs for their independently managed non-monetary policy portfolios. Additional publications are made available on the ECB website on a rolling basis throughout the year.
3.2 Overview of the environmental management system
As outlined above, the ECB Environmental Statement 2025 presents environmental data on the three ECB premises covered by the EMS. These include the ECB-owned main building and the two rented facilities in Frankfurt’s city centre – the Eurotower and the Japan Center. The data for the main building are presented separately from the aggregated data for the city centre premises. All office space across these three buildings is fully occupied by the ECB.
The ECB’s environmental policy outlines its overarching environmental goals and strategic direction. Originally adopted in 2007 and updated in 2013 to place greater emphasis on staff awareness and behavioural change, the policy underwent further editorial refinements in 2019 and 2024, adding biodiversity as one of the topics of relevance.
Both internal and external staff are encouraged to actively apply the principles of the environmental policy in their daily work, by implementing actions that contribute positively to the ECB’s environmental performance.
Figure 3
The ECB’s environmental policy

In 2024, the EMS successfully achieved its objective of continuously improving its performance as compared with the baseline year in 2019 and furthermore it proved its performance was very stable compared with the previous year. Remarkable progress was made in terms of communicating transparently to all stakeholders. For example, a new business area level travel dashboard was set up to help staff to become more aware of their business area’s travel behaviour, with a more thorough analysis of the real business travel needs. Both internal and external cooperation among stakeholders significantly improved in 2024. For instance, several business areas and voluntary groups within the ECB, as well as external institutions from the Frankfurt area collaborated and organised a full week of awareness-raising events for the United Nations’ International Day for Biological Diversity. The ECB’s operational carbon footprint furthermore remains well below the linear decarbonisation path, meaning that it is well on track for the Paris-aligned target of a 46.2% reduction in carbon emissions by 2030.
Chart 1
ECB’s carbon footprint and Paris Agreement alignment
(tonnes CO2 equivalent)
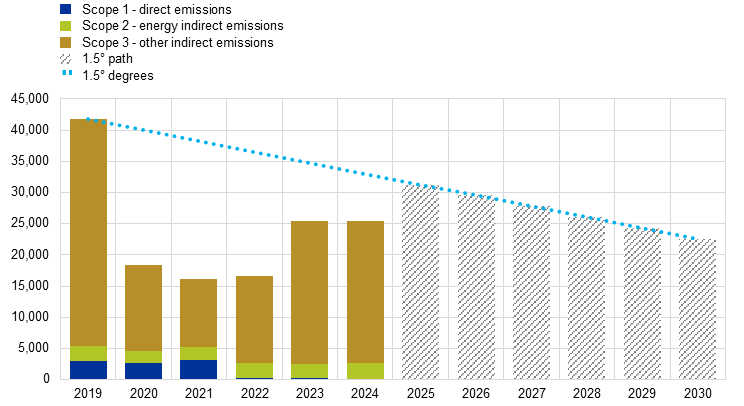
Source: ECB.
For further information on the ECB’s operational carbon performance, please see Chapter 5 – The ECB’s carbon footprint.
3.3 Environmental management organisation
The Green ECB team oversees all elements of the EMS and coordinates related activities in collaboration with various stakeholders. The team is headed by an Environmental Coordinator and an Environmental Officer, both appointed by the ECB’s Executive Board and supported by environmental experts. To ensure the EMS is effectively implemented across the institution, Environmental Representatives are designated within each business area by their respective senior management. The Environmental Coordinator and Environmental Officer report to the Executive Board, via the Chief Services Officer, on EMS-related matters and performance.
Figure 4
Organisational structure of the EMS

Table 1
Roles and responsibilities
The Green ECB team also contributes to the corporate sustainability workstream in the ECB’s climate change centre (CCC) – a unit established in 2021 to consolidate and coordinate the ECB’s climate-related activities. The CCC supports a structured approach to the strategic planning and alignment of climate initiatives across the institution. Its work is organised around six thematic areas that cover all climate-related efforts at the ECB: (i) financial stability and prudential policy, (ii) macroeconomic analysis and monetary policy, (iii) financial market operations and risk management, (iv) EU and international policy and regulation, (v) data, and (vi) corporate sustainability. In addition, the CCC serves as a hub for sharing knowledge on cross-cutting climate work in areas such as research, market infrastructure and payments, legal matters and banknotes.
Since 2010 the ECB’s EMS has been registered under the European Eco-Management and Audit Scheme (EMAS).[6] It has also been certified according to the ISO 14001 environmental management standard.
The governance structure for the EMS is set out in the ECB’s Environmental Management Handbook, which defines the procedures and operational processes required to maintain compliance with relevant standards. In line with EMAS and ISO 14001 requirements, to ensure adherence to its framework the EMS is subject to both internal and external verifications.[7] Internal verifications are conducted annually by the Environmental Officer, supported by external specialists, while accredited environmental verifiers carry out external verifications.
Since the publication of the ECB Environmental Statement 2022, no significant changes (such as a substantial scope extension) have been implemented in the EMS. The ECB occasionally updates some of the environmental data retrospectively in the latest Environmental Statement to ensure the accuracy, reliability and integrity of its analyses, reports or decisions. This may be required for a number of reasons. For example, data that was initially unavailable subsequently become retrievable, providing a broader picture. Similarly, errors such as incorrect data submissions, misapplied methodologies or human error upon data input or processing may lead to inaccuracies that require correcting. Sometimes, relevant data may have been erroneously excluded owing to oversight or misclassification, potentially compromising the validity of results. By reviewing and correcting such issues, the ECB ensures its data outputs remain credible and accurate, reflecting the most comprehensive information currently available.
4.1 Enhanced environmental objectives and measures
As a European institution, the ECB is committed to implementing measures to safeguard the environment and address climate change in its everyday operations. In 2021 the ECB adjusted its carbon-reduction targets to align with the Paris Agreement’s aim of capping the global temperature rise to 1.5 degrees Celsius above pre-industrial levels. This commitment translates into reducing the carbon emissions of the ECB’s internal operations by 46.2% by 2030, using 2019 as the baseline year.[8] The first EMS cycle following this alignment with the Paris Agreement objectives has now concluded. Building on the experience of the past three years in a post-pandemic environment, the updated EMP 2025-2027 introduces additional enabling actions aimed at further decarbonising the ECB’s operational activities to meet its 2030 emissions target. The key areas addressed are energy, emissions, materials and waste, biodiversity and procurement as well as awareness raising and stakeholder management. Throughout the cycle, the ECB will regularly review its targets and may propose additional objectives and measures for the medium and long term, also considering the European Union’s 2050 climate neutrality goal and the related legislative developments.
The EMP 2025-2027 has been developed in conjunction with various business areas and operational teams across the ECB and comprises a new set of comprehensive measures aimed at supporting the fulfilment of the common organisational environmental objectives. The new and updated objectives and measures focus on addressing significant contributors to the ECB’s carbon footprint, particularly travel-related activities, as well as green procurement procedures. The EMP will be followed up through status updates in the upcoming releases of the Environmental Statement in 2026 and 2027.
In the long term, the primary strategies to reduce emissions stemming from internal operations include decarbonising the energy supply, improving the environmental sustainability of business travel and coordinating at the Eurosystem level to align travel practices.
Figure 5
Updated environmental objectives

A more detailed overview of all environmental objectives and measures can be found in Chapter 5 – The ECB’s carbon footprint and Chapter 6 – Environmental aspects and impacts of the ECB’s activities.
Note: “Completed” = measure completed; “In progress” = measure in progress; “Pending” = measure still to be implemented; “New” = measure stemming from the new EMP.
In line with the Greenhouse Gas Protocol framework, the ECB classifies carbon emissions as scope 1, 2 and 3. Scope 1 includes direct emissions and scope 2 and scope 3 include indirect emissions. The scope of the greenhouse gas inventory has been expanded since 2023 and now includes further emissions stemming from the external data centre. The emissions from this source have also been included retrospectively to depict external data centre emissions from 2021 onwards. Figure 7 displays the ECB’s emissions sources sorted by their respective scopes.
Figure 7
Components of the ECB’s carbon footprint

Source: ECB.
Total emissions saw a marginal decrease of 0.2% compared with 2023. While scope 1 emissions continued to decline in 2024 (-38%), mainly owing to a drop in emissions from cooling agent losses, scope 2 emissions increased by 13.2% as a result of increased heating and cooling consumption across all three buildings. Scope 3 emissions decreased in 2024 (-1.2%) and continue to be strongly influenced by business travel-related emissions and conference participants’ travel-related emissions.
Chart 2
Total CO2e emissions – scopes 1, 2 and 3
(tonnes CO2 equivalent)

Source: ECB.
Notes: Scope 3 values were revised from 14,004.3 to 14,022.3 tonnes of CO2e for 2022 and from 22,609.3 to 22,956.6 tonnes of CO2e for 2023. Results are depicted for 2019, as this is the baseline year for the ECB’s long-term emissions reduction objectives, and for the last three years for which data are available. For earlier results, please see previous environmental statements. Cooling agents were replaced in 2024 with an alternative with a lower global warming potential to further support the emissions reduction.
The ECB focuses on avoidance of emissions, followed by their reduction. As the third and final component of its emission management, since 2018 the ECB has compensated unavoidable emissions with credits that finance emission avoidance projects worldwide. In addition, suppliers already compensate for upstream emissions from train travel within Germany[10] and a share of office paper.
For further information on data, see Chapter 7 – Technical information.
5.1 Emissions related to the operation of the ECB’s premises
Emissions from the operation of the ECB’s premises, including heating, cooling, fuel use and cooling agent losses are counted as direct emissions under scope 1 and as indirect emissions under scope 2. In 2024 combined scope 1 and scope 2 emissions accounted for 10.8% of the ECB’s total carbon footprint.
Upstream emissions from the ECB’s energy consumption are included under scope 3 (see Chapter 5.2 – Indirect emissions). Scope 2 emissions are reported in this chapter according to the market-based approach, while location-based emissions are reported in Chapter 7 – Technical information.
Chart 3
CO2e emissions – scopes 1 and 2
(tonnes of CO2 equivalent)

Source: ECB.
Note: Results are depicted for 2019, as this is the baseline year for the ECB’s long-term emissions reduction objectives, and for the last three years for which data are available. For earlier results, please see previous environmental statements.
5.2 Indirect emissions
In 2024 indirect emissions included under scope 3 made up 89% of the ECB’s total carbon footprint. Further details on developments in scope 3 emissions can be found in Chapter 6 – Environmental aspects and impacts of the ECB’s activities.
5.2.1 Business travel and hotel stays
Business travel emissions increased by 4.6% relative to 2023, while emissions arising from hotel stays rose by 10.7%. Despite this increase, the ECB continues to operate at 28.6% below 2019 travel emissions levels. However, the objective of limiting annual travel-related CO2 equivalent (CO2e) emissions to a maximum of 60% of pre-pandemic levels has not been met, with current levels standing at 72%.
Business travel-related emissions remain a key focus for the ECB, with efforts directed at reducing emissions to meet the set target. To support this work, a dedicated travel dashboard has been set up to monitor travel-related emissions across business areas and identify key areas of action.
Emissions calculations follow a best practice approach, using Well-to-Tank (WTT)[11] emissions for all fossil fuel-based transport and applying the Radiative Forcing Index (RFI)[12] for air travel. By adopting these approaches, the ECB ensures a comprehensive and accurate assessment of travel-related emissions using a best practice approach. For further details on travel activities, see Chapter 6.9 – Travel.
5.2.2 Conference participants’ travel
In addition to the business travel-related emissions of its own staff, the ECB includes emissions stemming from external participants attending conferences and events held at the ECB. The same calculation approach as for business travel is applied, i.e. calculating WTT emissions for fuel-based transport and applying RFI factors for travel by plane.
Although it has limited influence on conference participants’ emissions, the ECB has been regularly reporting on conference participants’ travel arrangements since 2021 to provide as complete a picture of their carbon emissions as possible. In 2024 conference participants’ travel-related emissions decreased by 6.1% compared with 2023. The ECB acknowledges that limitations in data quality mean that calculations of conference participants’ travel emissions rely on certain assumptions. To actively manage these travel-related emissions, the ECB set a target to limit the number of conferences and meetings with external participants held on its premises to 50% in the EMP 2022-2024, further extending an adjusted version of this measure to the updated EMP. For further details and data developments, see Chapter 6.9 – Travel.
Staff commuting and teleworking
Following the introduction of the teleworking regime at the beginning of 2023, which allowed staff to work remotely for up to 110 days per year, a part of the ECB’s emissions was shifted to employees’ homes. Given the close intercorrelation between staff commuting and teleworking data, the ECB includes these emissions in its carbon footprint boundary under the category “Emissions from staff commuting and teleworking”.
To assess these emissions, the ECB conducts a staff survey every two years. The most recent survey was carried out in the summer of 2023. The collected data are supplemented with additional information, such as the number of staff on business travel, and adjusted for factors such as sick leave and parental leave rates to improve the accuracy of the estimates. In 2024 emissions stemming from teleworking decreased by 21%, totalling 310.6 tonnes of CO2e emissions. By contrast, emissions from staff commuting increased by 20.7%, reaching 1,572.9 tonnes of CO2e emissions. The ECB acknowledges the limited reliability of the teleworking and commuting emissions data, which are based on underlying assumptions and a survey-based approach.
To promote green mobility among its staff, the ECB launched a programme that offers free access to the first hour of a bicycle-sharing service. Since this offer is valid in several German cities, it encourages green mobility beyond commuting for work. For further information on the survey-based approach for emissions data, see Chapter 6.9 – Travel.
5.2.3 Waste
Although waste consumption has increased by 1.7%, waste-related emissions decreased by 38.3% in 2024 compared with the previous year. This reverse effect is due to a significant reduction in emission factors.[13] With the imminent relocation of the ECB from the Eurotower to the Gallileo Tower and the introduction of activity-based working across the ECB in 2025, waste-related emissions are, however, expected to rise temporarily in the near future as a result of the new construction and transition process. Therefore, a new EMP objective was recently introduced for waste “maintaining the annual amount of residual waste at no more than 20% above the average waste generated between 2023 and 2024” specifically to act as a buffer for this temporary increase in waste resulting from these processes. For further information, see Chapter 6.5 – Waste and recycling.
5.2.4 Purchased goods and services
Purchased goods and services comprise emissions from catering and cleaning services, external printing, ICT services, gardening services, office supplies and stationery as well as paper consumption for office purposes, ECB publications and other printed materials, in addition to the external data centre and fresh and waste water consumption.
Emissions from catering services are assessed based on the ingredients used, with emission factors accounting for their full lifecycle, including transport. Emissions from printing services refer to both paper production and the electricity used by external providers. Gardening services-related emissions include fuel consumption for maintenance work. Emissions stemming from office supplies, stationery and cleaning services are estimated using a value-based approach, as detailed consumption data are not available and relevant emission factors are lacking. Additionally, the ECB considers ICT-related emissions other than data centre operations and the consumption of IT equipment, also factoring in the duration of videoconferences conducted by ECB staff.
The scope of the greenhouse gas inventory has been expanded since 2023 to include further emissions from the external data centre consumption, in addition to emissions arising from electricity consumption, which have been included since 2021. Corresponding to the ECB’s share of the total capacity of the external data centre, energy consumption for cooling, the fuel consumption of the emergency power units, water consumption and cooling agent losses have been reported and included under scope 3 emissions. These emissions have also been included retrospectively from 2021 onwards.
Emissions from electricity at the external data centre decreased by 12.3% compared with 2023, while emissions arising from the emergency unit decreased by 21% in 2024. Cooling agent losses at the external data centre were reported for the first time in 2024 and retrospectively as of 2021, amounting to 3.8 tonnes of CO2e emissions. Emissions stemming from waste water decreased by 12.1% in 2024.
Despite the extension of this category, emissions from purchased goods and services declined by 13.0% compared with 2023, totalling 1,549.5 tonnes of CO2e emissions which represented 6.8% of all scope 3 emissions in 2024. Notably, emissions from videoconferences grew by 191% compared with 2023, largely as a result of increased availability of data used for these calculations.
Chart 4
CO2e emissions – scope 3
(tonnes CO2 equivalent)

Source: ECB.
Notes: Upstream energy includes emissions from the car fleet, the emergency unit, biogas and district heating, as well as electricity from renewable energy sources (wind and hydropower). Emissions from upstream energy were revised from 641.3 to 646.8 tonnes of CO2e in 2022 and from 650.5 to 655.8 tonnes of CO2e in 2023. Conference participants’ travel emissions were revised from 4,091.2 to 4,418.9 tonnes of CO2e in 2023. Emissions stemming from purchased goods and services were revised from 1,251.5 to 1,264.0 tonnes of CO2e in 2022 and from 1,767.6 to 1,781.9 tonnes of CO2e in 2023. Results are depicted for 2019, as this is the baseline year for the ECB’s long-term emissions reduction objectives, and for the last three years for which data are available. For earlier results, please see previous environmental statements.
Chart 5
Scope 3 – shares of CO2e emissions in 2024

Source: ECB.
Aside from CO2e emissions, the ECB records and calculates other emissions generated by its activities. Thus, emissions of sulphur dioxide (SO2), nitrogen oxides (NOX) and particulate matter (PM) stemming from the fuel consumption of the ECB’s vehicle fleet and emergency power unit test runs are reported. In addition, the ECB reports on biogenic emissions resulting from biogas consumption in line with the requirements of the Greenhouse Gas Protocol. For more information, see Chapter 7 – Technical information.
6.1 Update of the environmental aspects assessment
The direct and indirect environmental aspects of the ECB’s activities are assessed on an annual basis. This assessment is based on the ECB’s ability to influence each aspect and their significance for its environmental performance. Risks and opportunities that affect significant environmental aspects at the ECB – and that may affect the achievement of objectives and measures – are analysed as part of this exercise. Where necessary, subsequent steps are identified which either feature as corrective actions that are assessed in the internal verification process or are discussed as new EMP measures.
Overall, the classification of the environmental aspects remained stable in 2024 compared with 2023. The level of the ECB’s ability to influence in terms of recycled paper consumption shifted from medium to low and for white paper consumption from high to low. Both positive changes are the result of a significant reduced paper consumption rate in 2024 as compared with 2023, by 72% and 71% respectively. The significance level of hazardous substances shifted from medium to low, as paper consumption further decreased by 27%. Energy consumption in the external data centre was included as a separate indirect environmental aspect in 2024, thus acknowledging further environmental influences from a relevant procured service.
Figure 8
Assessment of the ECB’s direct environmental aspects

Source: ECB.
Note: The classification of the environmental aspects changed only slightly in 2024 as compared with 2023. This is because the level of the ECB’s ability to influence in terms of recycled paper consumption shifted from medium to low and for white paper consumption from high to low. The significance level of hazardous substances also shifted from medium to low.
Figure 9
Assessment of the ECB’s indirect environmental aspects

Source: ECB.
Note: Energy consumption by the external data centre was added as a new indirect environmental aspect to reflect the corresponding environmental effects.
6.2 Energy efficiency
Note: The energy consumption in the baseline year 2018 was 12,153 kilowatt hours per workplace and the total energy consumption was 65,000 megawatt hours.
Measure |
Status |
|---|---|
Evaluate adherence to the European Code of Conduct on Data Centre Energy Efficiency (ECA)[14] recommendation |
In progress Colleagues in the ECB’s Directorate General Information Systems (DG/IS) are currently evaluating the adherence to the European Code of Conduct on Data Centre Energy Efficiency Implementation will be continued as part of the new EMP |
Further expand and optimise data collection and analysis of energy consumption from the data centres at the main building |
Completed Implementation will be continued through a re-issued measure in the new EMP |
Carry out an assessment of the ten floors with the highest consumption to identify potential improvement opportunities |
New |
Explore opportunities to develop a systematic energy management approach, including identifying and monitoring consumption sources, to uncover efficiency opportunities |
New/ In progress |
Investigate average ECB on-site workplace energy consumption (e.g. laptops, monitors) and factor this information into teleworking-related emissions calculations |
New/ In progress |
Explore the feasibility of further differentiating between various energy streams |
New |
Test and roll out improvements to temperature control processes in the high-rise sections of the main building |
Completed Energy efficiency measures were widely introduced across the ECB buildings in response to the European and German guidelines and regulations on energy efficiency. The effectiveness of energy saving measures continues to be closely monitored to seek further optimisation potential |
Conduct lighting assessments to evaluate lighting needs and technical installations |
In progress Lighting assessment of the main building’s lighting system is under way, with a gradual approach to replace light fixtures in accordance with the needs and technical installations currently in place Implementation will be taken up again as part of the new EMP |
Conduct an analysis of the potential impact on energy efficiency of shutting down lighting and heating in the office areas outside working hours, and assess the savings opportunities |
New |
Calculate the environmental benefits of replacing the existing lighting with LEDs using ValERI methodology in the main building |
New |
Replace light fixtures in the conference areas, the Grossmarkthalle barrel-vaulted ceiling and underground parking area with LEDs |
New |
Assess ways to further optimise heating and cooling throughout the premises, considering the buildings’ technical features and staff needs |
New |
Explore opportunities to extend energy saving measures from the current building stock to future rented buildings |
New |
Explore possibilities to optimise the energy-efficient usage of refrigerated areas |
New |
Continuously assess cloud service usage to identify improvement opportunities and reduce the corresponding environmental impact |
In progress DG/IS is currently working with the service providers to embed metrics on the environmental performance of cloud services Implementation will be taken up again as part of the new EMP |
Continuously assess cloud service usage to identify improvement opportunities and reduce the environmental impact |
New/ In progress |
Systematically increase the energy efficiency of data centres whenever feasible, adjusting operational parameters and/or optimising the usage of existing infrastructure |
New/ In progress |
Maintain the current daytime cleaning concept at the ECB |
New/ In progress |
Note: “Completed” = measure completed; “In progress” = measure in progress; “Pending” = measure still to be implemented; “New” = measure stemming from the new EMP.
The ECB’s overall energy consumption increased by 6.1% in 2024 compared with the previous year and was 18.7% lower than in 2019. The ECB continues to identify and implement energy efficiency measures to further reduce on-site energy consumption and therefore introduced an energy dashboard which enhances the monitoring of energy consumption. As in previous years, minimum and maximum temperatures were set for summer and winter, with older appliances being replaced with more energy-efficient alternatives. The ECB is also part of a local energy efficiency network and shares information on energy saving measures at the Eurosystem level, both of which provide new input on measures that could be implemented on ECB sites.
The ECB acknowledges that changes in working environments and modalities, such as adaptations to teleworking regimes or an increased utilisation of cloud services and artificial intelligence, affect environmental aspects and is continuously exploring opportunities to improve its approach accordingly. For instance, the ECB is currently evaluating its ability to quantify the environmental impact of cloud services and is exploring market best practices to better understand how this can impact the achievement of longer-term targets. Additionally, considerations on energy performance targets and changes to office spaces owing to new working models are relevant issues for the ECB’s real estate management and strategy.
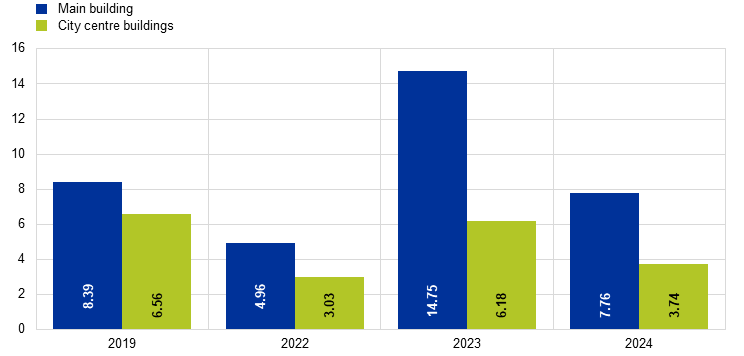
In 2024 electrical energy consumption in the main building increased slightly, by 3.3%, while energy consumption for heating and cooling rose by 8.6% compared with the previous year. Parts of the main building were closed for construction work in 2023. Consequently, the return of staff to the workplace in 2024 triggered an upward trend in electricity and heating consumption. The increase in heating and cooling energy can further be explained by the renewed use of underfloor heating in the entrance and bistro areas. The amount of biogas used for cooking in the kitchen of the main building also increased by 5.7%. By contrast, the stepwise migration to cloud services has led to a gradual reduction in electricity consumption in the internal data centre.
At the city centre premises, electrical energy consumption increased in 2024 by 4.7%. Consumption of energy for heating and cooling increased by 10.5%, partially explained by the commissioning of a new pure steam generator in the Japan Center in June 2024. In addition to procured energy, two cogeneration plants powered by biogas are used in the Eurotower to generate heat and electrical energy. In 2024 the consumption of biogas dropped very slightly, by 5.3%, compared with 2023. In comparison with previous years, an increase in generated energy was observed following the optimisation of the run times of both cogeneration plants.
Chart 6
Energy consumption – main building[15]
(MWh)

Source: ECB.
Notes: Results are depicted for 2019, as this is the baseline year for the ECB’s long-term emissions reduction objectives, and for the last three years for which data are available. For earlier results, please see previous environmental statements. Owing to a change in metering devices and, consequently, a non-retraceable loss of information, geothermal energy data for April and May were not reported and are therefore not included here.
Chart 7
Energy consumption – city centre buildings
(MWh)

Source: ECB.
Notes: Energy consumption at the external data centre is no longer included in this chart, as related emissions have been allocated to “purchased goods and services” as part of the expansion of scope 3. For more information, see Chapter 5.2 – Indirect emissions.
Purchased electrical energy consumption was revised from 10,248.8 to 10,265.8 MWh in 2022 and from 9,584.3 to 9,455.9 MWh in 2023. Results are depicted for 2019, as this is the baseline year for the ECB’s long-term emissions reduction objectives, and for the last three years for which data are available. For earlier results, please see previous environmental statements. For more information on greenhouse gas emissions associated with energy consumption, see Chapter 5.1 – Emissions related to the operation of ECB premises.
6.3 Material efficiency
Timeline |
Objective and status 2024 |
|---|---|
Short-term: 2027 (new) |
Ensure that at least 80% of orders for office supplies stem from the sustainable office supply catalogue |
New |
|
Short-term: 2024 |
Phase out all disposable plastic items in catering outlets and kitchen operations |
Status 2024: Completed |
Note: “Completed” = measure completed; “In progress” = measure in progress; “Pending” = measure still to be implemented; “New” = measure stemming from the new EMP.
The ECB is continuously seeking ways to reduce packaging waste in its operations, including in the bistro and canteen areas, in collaboration with its external services provider. With the goal of reducing the environmental impacts of single-use packaging in customer-facing outlets and kitchen operations, the packaging of take-away items in the vending machines and bistro areas has been changed to a more sustainable, grass-based solution. The use of reusable packaging is also actively encouraged for take-away items, wherever the uptake of food-grade alternatives is feasible.
Developments in the consumption of resources from publications, office paper, cleaning agents, office supplies and chemicals for water treatment and cooling are shown in the following sections. For more information on CO2e emissions, see Chapter 5.2 – Indirect emissions.
6.3.1 Publications
As in 2023, the ECB’s official publications were fully digital in 2024 and therefore no paper consumption for official publications was reported.
Chart 8
Paper consumption for official publications
(tonnes)

Source: ECB.
6.3.2 Office paper
The consumption of office paper decreased by 71.4% compared with 2023. This was the result of an overstock in 2023 which led to large quantities still being available for use in 2024. Consequently, orders were merely placed when needed and lower quantities of purchases were required overall. Recycled paper accounted for 97.5% of purchases in the year.
As in the previous year, ECB calendars were printed on-site in 2024. The paper required for the printing is included in the consumption figures for paper for office use.
Chart 9
Office paper consumption
(thousands of sheets of A4 equivalent)

Source: ECB.
Notes: Results are depicted for 2019, as this is the baseline year for the ECB’s long-term emissions reduction objectives, and for the last three years for which data are available. For earlier results, please see previous environmental statements.
6.3.3 Cleaning agents
The ECB has a non-chemical cleaning regime in place for regular cleaning services in all its buildings, using microbiological detergents, aqueous ozone and mechanical cleaning means. Seat disinfectant has also recently been phased out in favour of a microbiological cleaning solution. The amount of microbiological cleaning agents in use decreased by 54.7% in 2024. This was because fewer cleaning agents were ordered in 2024 owing to an overstock in 2023. Furthermore, the concentration of the microbiological cleaning agents has been optimised by the manufacturers, so smaller quantities were required overall.
In 2024 the contracted catering company for the main building also took responsibility for the catering operations in the city centre buildings, streamlining the associated cleaning processes of the catering areas in all three premises. In the main building, the use of hazardous chemicals in catering operations increased by 8.4% compared with 2023 and the use of non-hazardous chemicals decreased by 52%. In the city centre buildings, the use of hazardous chemicals decreased by 36.8% and the use of non-hazardous chemicals increased by 79%. The differences observed in the main building can be attributed to a change in cleaning agent suppliers. The change of catering providers from 2023 to 2024 makes it difficult to pinpoint the reason for the varying quantities in the city centre premises.
Chart 10
Cleaning agent consumption
(tonnes)
Source: ECB.
Notes: Results are depicted for 2019, as this is the baseline year for the ECB’s long-term emissions reduction objectives, and for the last three years for which data are available. For earlier results, please see previous environmental statements.
6.3.4 Office supplies
The ECB advocates the use of environmentally friendly stationery by highlighting items and products with eco-labels in the stationery catalogue. Throughout 2024 the ECB worked with suppliers to gradually increase the number of sustainable products in this catalogue. As a result, 51.7% of stationery items listed in the catalogue were labelled eco-friendly in 2024, an increase of 13.7% compared with 2023. The ECB is exploring ways to further increase this rate. Staff are encouraged to return unused stationery and other office supplies to logistics storage for reuse by staff. Additionally, a loan catalogue was introduced as a pilot project, where staff can take items out on loan and return them when they are no longer needed. When purchasing non-standard office supplies outside the stationery catalogue, priority is given to sustainable products whenever possible.
6.3.5 Chemicals for water treatment and cooling agents
In 2024 chemicals used for water treatment decreased by 33.3% in the main building and increased by 34.1% in the city centre premises compared with 2023. The increase for the city centre buildings can be explained by the higher water consumption in both buildings in 2024. For the main building, cooling agent losses of 12 kilograms caused by accidental leakages were reported in 2024, marking a 74.5% decline compared with 2023. In the city centre premises, cooling agent losses of 19 kilograms were reported.
Chart 11
Chemicals used for water treatment
(tonnes)

Source: ECB.
Chart 12
Cooling agent losses
(kilograms)

Source: ECB.
Note: Results are depicted for 2019, as this is the baseline year for the ECB’s long-term emissions reduction objectives, and for the last three years for which data are available. For earlier results, please see previous environmental statements.
6.4 Water and waste water

The ECB analyses technical and non-technical water consumption in all its premises. The scope of technical water includes the water used for temperature control in the premises. Non-technical water covers water use in sanitary facilities, kitchenettes and canteens. Irrigation water for the trees in the green areas of the main building is included under non-technical water consumption and thus influences overall consumption when comparing non-technical water consumption in the main building with that of the city centre premises.

Fresh water consumption in the main building increased by 19.9% and non-technical water consumption rose by 24% compared with 2023. Technical water consumption increased by 1.6%. The rise in fresh water consumption can be partly explained by a greater need for irrigation water. While fresh water and non-technical water consumption have increased compared with 2023, a decrease of 57.7% and 60.1% respectively was observed in comparison with 2019. This can be explained by water saving measures such as limiting the outside irrigation of trees and the reduced need for technical water for cooling as a result of a decrease in data centre use.
At the city centre premises, fresh water consumption increased by 33.3% compared with 2023. Similarly, non-technical and technical water consumption increased by 32.6% and 36.3% respectively. The increase in fresh water consumption can be attributed primarily to the regular flushing of water pipes to meet hygiene requirements. Flushing volumes are set to be reduced in the future by means of automatic flushing stations. In the Japan Center, the commissioning of a pure steam generator in June 2024 increased technical water consumption.
More information on the CO2e emissions related to water and waste water can be found in the subsection on purchased goods and services in Chapter 5.2 – Indirect emissions.

Chart 13
Water consumption – main building
(m³)

Source: ECB.
Notes: Results are depicted for 2019, as this is the baseline year for the ECB’s long-term emissions reduction objectives, and for the last three years for which data are available. For earlier results, please see previous environmental statements.
Chart 14
Water consumption – city centre buildings
(m³)

Source: ECB.
Note: For more information on greenhouse gas emissions associated with water and waste water, see the section on purchased goods and services in Chapter 5.2 – Indirect emissions. Technical fresh water consumption was revised from 7,643.1 to 6,464.1 m3 and non-technical fresh water consumption was revised from 28,305.9 to 29,485.9 m3 in 2023. Results are depicted for 2019, as this is the baseline year for the ECB’s long-term emissions reduction objectives, and for the last three years for which data are available. For earlier results, please see previous environmental statements.
6.5 Waste and recycling
Timeline |
Objective and status 2024 |
|---|---|
Short-term: 2027 (new) |
Maintain the annual amount of residual waste at no more than 20% above the average waste generated between 2023 and 2024 |
New |
Note: “Completed” = measure completed; “In progress” = measure in progress; “Pending” = measure still to be implemented; “New” = measure stemming from the new EMP.
Total waste generation amounted to 567 tonnes in 2024, representing an increase of 1.7% compared with 2023. Of the 567 tonnes of total waste, 541 tonnes (95.4%) were non-hazardous waste, including paper and cardboard waste, confidential paper waste, organic and residual waste. Hazardous waste accounted for 4.6% of total waste (26 tonnes), including waste from batteries and various electronic waste fractions containing hazardous components as well as waste from construction projects. In 2024 the ECB once again donated some IT equipment, allowing old devices to be reused and helping to reduce IT waste. The ECB considers waste reduction and separation an important issue, of which it continues to raise awareness among staff and service providers. All newcomers, suppliers and employees are provided with specific up-to-date information on waste separation at the ECB.
The amount of total waste generated at the main building rose by 18.1% in 2024 compared with 2023. Residual waste increased by 37.3%, paper and cardboard waste by 7.1% and organic waste by 4.5%. Confidential paper waste saw an increase of 40.4%, owing to the disposal of unnecessary physical documentation. The total amount of waste generated in the main building remained at a consistently lower level in 2024, with a decrease of 43% compared with 2019.
The amount of total waste produced at the city centre premises declined by 13.8% compared with 2023. Most notably, residual waste was reduced by 49.2%, from 53.8 tonnes in 2023 to 27.3 tonnes in 2024. Similarly, the amount of packaging waste dropped by 54.4% to 7.7 tonnes in 2024. The amount of paper and cardboard waste was reduced by 22.7%, from 15.2 tonnes in 2023 to 11.8 tonnes in 2024. Confidential paper waste decreased by 12.8% compared with 2023. Relative to 2019, the ECB reduced total waste generated at the city centre premises by 37%.
Chart 15
Waste and recycling – main building
(tonnes)

Source: ECB.
Notes: Residual waste refers to commercial waste similar to household waste. Results are depicted for 2019, as this is the baseline year for the ECB’s long-term emissions reduction objectives, and for the last three years for which data are available. For earlier results, please see previous environmental statements.
Chart 16
Waste and recycling – city centre buildings
(tonnes)

Source: ECB.
Notes: Residual waste refers to commercial waste similar to household waste.
For more information on greenhouse gas emissions associated with waste, see Chapter 5.2 – Indirect emissions. Results are depicted for 2019, as this is the baseline year for the ECB’s long-term emissions reduction objectives, and for the last three years for which data are available. For earlier results, please see previous environmental statements.
Table 2
Breakdown of waste types in accordance with the German Commercial Waste Ordinance
Commercial waste |
Waste amounts in 2024 (tonnes) |
|
|---|---|---|
ECB total |
Organic waste |
148.81 |
Residual waste |
75.40 |
|
Paper waste |
90.12 |
|
Packaging waste |
14.48 |
|
Glass waste |
8.45 |
|
Bulky waste |
1.13 |
|
Packaging waste (wood) |
5.80 |
|
Total waste as per the Commercial Waste Ordinance |
Total commercial waste |
344.19 |
Separate collection rate |
78.1% |
|
Notes: Waste amounts displayed in Table 1 partly differ from the amounts displayed in Charts 14 and 15 owing to the different categorisation of waste under the Commercial Waste Ordinance: organic waste does not include grease separator waste; packaging waste does not include packaging waste disposed of via the German dual system “Der Grüne Punkt”; and paper waste includes both paper and cardboard waste as well as confidential paper waste.
Total waste as defined by the German Commercial Waste Ordinance amounted to 344.19 tonnes in 2024, representing a 1.7% decrease compared with 2023. Separately collected commercial waste (total waste excluding residual waste) under the Commercial Waste Ordinance amounted to 268.8 tonnes, marking a 2.7% decline compared with 2023. Residual waste is pre-sorted and disposed of at a certified treatment plant.
6.6 Biodiversity
Note: “Completed” = measure completed; “In progress” = measure in progress; “Pending” = measure still to be implemented; “New” = measure stemming from the new EMP.
In 2024 the ECB continued to enhance its biodiversity initiatives, building on the strategies and practices developed in previous years. The ECB's approach to biodiversity is rooted in preserving and fostering biodiversity, species conservation and the sustainable management of green spaces. This year, significant progress was made through developing an environment that supports diverse wildlife and plant species, while raising awareness among staff.
Progress was made on the creation of a dedicated nature trail on the ECB’s grounds. The trail is designed to inform staff about the site's biodiversity and information boards are expected to be installed to highlight the concrete measures taken to enhance biodiversity and species protection.
In 2024 the ECB further promoted native flora by planting more indigenous hedges, flower beds and fruit trees. Four trees were planted as well as 100 shrubs to form a large hedge and 200 square metres of flower beds were sown. Additionally, piles of deadwood were introduced over the course of the year, created from the branches and twigs left over from the regular pruning of the trees on-site, providing various species with shelter and enhancing nutrient cycling within the ecosystem. These enhancements to the garden not only contribute to the aesthetic appeal of the ECB’s grounds, but also provide essential habitats and food sources for local wildlife. The planting of native species supports the resilience of the ecosystem, particularly as the ECB site is classified as a dry biotope by the City of Frankfurt's environmental office.
Aware of the importance of preserving this dry biotope classification, the ECB has created two sand dunes on its premises. These dunes provide specialised habitats for ground-breeding insects, such as wild bees and some grasshopper species, thereby contributing to the ecological diversity and sustainability of the area.
The ECB has initiated the comprehensive monitoring and documentation of plant and animal species found on its grounds. This work aims to compare the biodiversity present at the ECB with other areas in Frankfurt and the Hesse region, offering valuable insights into the effectiveness of current measures and identifying areas for further improvement. Monitoring experts are involved in this process and are providing recommendations to enhance biodiversity efforts.
As part of its ongoing commitment to biodiversity, the ECB once again organised a week of activities around the International Day for Biological Diversity. This dedicated Biodiversity Week featured several initiatives designed to engage and educate participants about the importance of biodiversity. The highlight of the week was a lecture that explored the intersection of sustainability, biodiversity and climate, offering valuable insights into how these areas are interconnected. More information on Biodiversity Week and the related awareness-raising undertakings can be found in Chapter 6.10 – Communication, engagement and awareness raising.
Consistent with previous years' water conservation efforts, lawn irrigation has been eliminated entirely. Instead, rainwater is collected and used to water raised beds while the irrigation of the trees is conducted using slow release watering bags, ensuring a minimal use of drinking water while maintaining the health of the ECB's green spaces.
6.7 Banknotes

As part of the Eurosystem’s cash strategy, the ECB endeavours to improve the sustainability of euro banknotes throughout the cash cycle.
The ECB and the Eurosystem NCBs have the exclusive right to issue banknotes within the euro area. At the end of 2024 there were 30.5 billion euro banknotes in circulation.
The ECB coordinates, monitors and regulates the design, production and circulation of euro banknotes. The ECB promotes good environmental management and seeks to avoid any risk to the health and safety of the general public, as well as to the workers involved in the production and circulation of euro banknotes. All manufacturers producing euro banknotes and the main raw materials must provide the ECB with copies of their ISO 9001, ISO 14001, ISO 45001 certificates and specific declarations showing that they conform to the applicable standards for quality, environmental, health and safety management, and ethical conduct of business. The ECB also monitors and assesses the environmental impact of the euro banknote production annually.
In 2022, the ECB assessed the environmental impact of the full cash cycle using a broad scope methodology, the Product Environmental Footprint (developed by the European Commission), while the ECB’s operational footprint was calculated using the Greenhouse Gas Protocol framework. The environmental footprint of euro banknotes as a payment instrument is very low, i.e. equivalent to 0.01% of the total environmental impact of a citizen. Emissions from banknotes are not included in the ECB’s operational carbon footprint, as banknotes are a joint responsibility of the Eurosystem as a whole.
The ECB and Eurosystem NCBs are implementing policies to further reduce the environmental impact of euro banknotes. For example, in 2024 the cotton fibres used to produce euro banknote paper came exclusively from sustainable sources. When banknotes reach the end of their life, they are disposed of using recovery and recycling methods. Disposal methods for euro banknotes at the end of their life such as landfill and combustion (burning with no energy recovery) have been banned since 2022.
The ECB is engaging with all stakeholders to identify further ways to improve the environmental sustainability of euro banknotes throughout the cash cycle, including the eco-design of future banknotes. In this vein, a series of research and development projects are now under way. These projects aim to improve the environmental sustainability of current and future euro banknotes by (i) increasing their circulation lifetime, (ii) using raw materials with less environmental impact, and (iii) developing more sustainable solutions for their end-of-life treatment.
Detailed information on the environmental impact of euro banknotes is available on the ECB’s website in the section on “The euro”.
6.8 Green public procurement
Notes: “Green procurement procedures” means procurement procedures that include environmental considerations (i) in the contract subject matter, (ii) in the technical specifications and requirements, (iii) through environmental selection and award criteria, (iv) by means of contract performance clauses, or (v) through a combination of (i) to (iv).
“ECB procurement procedures” means public tender procedures, three/five-quote procedures and direct awards on the basis of Articles 2 and 6 of the ECB’s rules on procurement.
“Most environmentally relevant procurement categories” constitute travel, rental of space, stationery, vehicles, events, representation, catering, building maintenance/construction works, printing and publication as well as post, energy and other utilities, furniture, hardware, technical equipment and assets, and other staff-related expenses.
Note: “Completed” = measure completed; “In progress” = measure in progress; “Pending” = measure still to be implemented; “New” = measure stemming from the new EMP.
In 2024 the ECB remained committed to achieving its environmental objectives by leveraging green public procurement to reduce the environmental impact stemming from its operations. The ECB embeds environmental considerations into its procurement processes and contracts, with a particular focus on areas such as cleaning, catering and facility management services, which have a significant environmental impact. This strategy surpasses simple regulatory compliance with environmental laws and regulations, seeking to achieve a meaningful and sustainable impact at every stage of the sourcing and procurement cycle for goods, works and services purchased by the ECB. Moreover, the ECB acknowledges the significant impact procurement has in advancing its comprehensive environmental management objectives. By leveraging its influence on the supplier base through its procurement procedures, the ECB strives to foster environmentally conscious practices throughout its value and supply chain and to inspire the adoption of sustainable best practices within its operations.
The ECB conducted 238 new procurement procedures[16] in 2024, of which 59 were green procurement procedures. This represents 24.8% of the total number of procedures and 58.3% of the total yearly value compared with 22.2% and 21.5% respectively in 2023. Although the ECB’s objective was to increase the share of green procurement procedures to at least 22.5% between 2022 and 2024, the actual average was marginally lower, at 21.6%. This owed mainly to the low number of green procurements in 2022. However, the target to raise the value of green procurement procedures to at least 25% during the 2022-24 cycle was considerably surpassed, with an average of 35.6% over this timeframe.
The ECB provides its staff with a sustainable procurement guidelines, which were updated in 2024 to incorporate environmental considerations alongside social factors, supporting a holistic approach to driving environmental gains. These guidelines provide essential background information and references on the purpose of sustainable procurement, along with detailed legal guidance, particularly for defining, specifying and assessing appropriate sustainable procurement requirements and criteria. It also includes updated examples for implementing sustainable procurement in practice. In addition, the ECB’s procurement handbook and standard procurement templates were updated in 2024 to clarify and streamline the integration of environmental considerations in procurement procedures. These comprehensive enhancements of the ECB’s green public procurement toolkit are expected to foster the increased greening of ECB’s procurements in the medium and long term. To further equip staff with the skills needed to integrate environmental aspects into their procurement procedures in an effective and compliant manner, the ECB continues to offer several dedicated training sessions on green public procurement. Additionally, building on the success of the 2023 Green Procurement Awareness Day, the ECB envisages organising similar events on a regular basis, with the next one scheduled for early 2025.
The ECB is actively involved in a collaborative initiative with other European institutions centred around a Green Public Procurement Helpdesk (GPP Helpdesk). This helpdesk serves as a platform for European institutions to enhance their green public procurement strategies by facilitating the exchange of best practices and market insights specifically related to this topic. Moreover, in 2024 the ECB launched a joint Eurosystem project aimed at mapping, researching and benchmarking sustainable procurement activities and practices across NCBs and national competent authorities, with a focus on Information System procurements. The project aims to establish a comprehensive database of information on specific procurement categories to be shared among participating institutions. This will allow them to gain further expertise and develop their knowledge, as well as enabling the standardisation and harmonisation of green public procurement practices among Eurosystem stakeholders.
6.9 Travel

Travel activities remained relatively stable in 2024 compared with 2023. The total distance travelled by ECB staff increased by 3.7% to 26,025,997 kilometres from the previous year, although this figure is still 35% lower than the levels recorded in 2019.[17] Carbon emissions associated with business travel followed a similar trend, showing a slight increase compared with 2023 but remaining well below 2019 levels. Specifically, in 2024 carbon emissions amounted to 9,134.5 tonnes of CO2e, marking a 4.6% increase from the previous year and a 28.6% reduction relative to 2019. Aviation-related emissions remained the largest contributor, accounting for 93% of total business travel-related emissions in 2024.
Chart 17
Emissions from business travel by car, plane and train and absolute number of kilometres travelled
a) Emissions
(tonnes of CO2 equivalent)

b) Absolute km travelled by transport means
(kilometres)

Source: ECB.
Note: Results are depicted for 2019, as this is the baseline year for the ECB’s long-term emissions reduction objectives, and for the last three years for which data are available. For earlier results, please see previous environmental statements.
The carbon emissions landscape remained challenging as the travel-related emission factors issued by the Department for Environment, Food and Rural Affairs in 2023 remained unchanged. These emission factors were 30% higher compared with 2022. As a result, emissions related to travel stayed high, undermining the efforts made to meet reduction targets. Despite a concerted push to curb travel, the total number of kilometres travelled in 2024 reached only 65% of the 2019 benchmark. However, given the persistently high emission factors, overall travel-related emissions were recorded at 72% of 2019 levels. This indicates that while there has been a significant reduction in travel volume, the gains in emission reduction were not as marked owing to the sustained increase in emission factors. Picking up on the significant effects of the measures that had been put in place in the last EMP, the objective to keep business travel-related emissions at 60% of 2019 levels was rolled over to the new EMP with a target year of 2027. This objective aims to capitalise on the new ways of working that arose in the pandemic to reduce travel-related impacts.
To reinforce the objective to reduce business travel-related carbon emissions, the ECB updated its internal travel rules to expand the default international destinations to be travelled to by train. Therefore, ECB staff must travel by train to all German destinations, Amsterdam, Basel, Brussels and Paris, with air travel only permitted in exceptional cases. A systematic review of the respective business travel rules to identify improvement opportunities to reduce the environmental impact of business travel was included as a measure in the EMP for the next EMS cycle. Additionally, through the long-established Environmental Network of Central Banks (ENCB), a designated working group was launched in 2024 with the aim of exploring a structured approach to making interinstitutional business travel and events more sustainable. To support this engagement, the ECB included a measure in the new EMP to introduce a common business travel guideline for Eurosystem (potentially ESCB) members to reduce physical travel. For more information on interinstitutional engagement, see Chapter 6.10 – Communication, engagement and awareness raising.
The introduction of a travel dashboard in 2024, detailing the environmental impact of travel activities throughout the institution split by business areas, marked a milestone in the monitoring of ECB staff travel choices. This allows for a more detailed analysis and supports business areas in making targeted and informed decisions about how the environmental sustainability of their travel activities can be enhanced. Exploring technical possibilities to enhance the travel booking platform by considering tools and functionalities has been included as a new measure in the EMP 2025-2027 to achieve more detailed emissions monitoring and steering.
Conference activities at the ECB decreased by 5% compared with the previous year, resulting in total carbon emissions of 4,149 tonnes of CO2e stemming from conference participants travelling to the ECB.[18] This marks a 62% reduction relative to 2019 levels.[19] Over 2023 and 2024 a total of 978 meetings took place in hybrid or physical format, representing 21.7% of all planned meetings and accomplishing the objective of limiting physical meetings and conferences with external participants to 50% over the two-year period. Building on the success of this objective, the ECB set an adjusted target to limit the average number of physical and hybrid meetings organised by the ECB with external participants on-site to the levels seen in 2024 (i.e. 541), on average over a two-year period, beginning with the upcoming 2026 planning exercise. To support and enable hybrid meetings in the future, advances were made on installing a hybrid set-up in most of the conference rooms in the ECB’s main building. Currently, 71% of conference rooms and 79% of central meeting rooms in all three buildings can host hybrid meetings. For further details on the progress of travel-related objectives and measures, see Chapter 5 – The ECB’s carbon footprint.
Staff commuting and teleworking emissions are derived from a survey conducted every two years, with the most recent survey being launched in the summer of 2023, following the implementation of the new teleworking policy. This policy permits a maximum of 110 teleworking days per calendar year, equivalent to about 50% of working time. Given the inherent limitations of survey-based methods, this emission source carries a higher degree of uncertainty and should therefore be interpreted with caution.
In 2024 emissions stemming from staff commuting to ECB premises amounted to 1,573 tonnes of CO2e, marking a 21% increase compared with 2023 but remaining 45% below 2019 levels. Conversely, emissions from teleworking decreased in 2024 compared with the previous year. These emissions contributed 311 tonnes of CO2e to the annual footprint, representing a 21% reduction relative to 2023. As in previous years, most teleworking-related emissions originated from heating consumption, which accounted for 72% of this emission source. These trends align with an increased on-site presence in the second year without pandemic-related restrictions. Greenhouse gas emissions relating to staff commuting to the ECB and teleworking are outlined in Chapter 5.2 – Indirect emissions.
6.10 Communication, engagement and awareness raising
Note: “Completed” = measure completed; “In progress” = measure in progress; “Pending” = measure still to be implemented; “New” = measure stemming from the new EMP.
Note: “Completed” = measure completed; “In progress” = measure in progress; “Pending” = measure still to be implemented; “New” = measure stemming from the new EMP.
2024 marked another dynamic period in which the ECB made progress on its environmental stakeholder engagement and awareness-raising activities. Building on the successes of previous years, the ECB introduced several new initiatives, while continuing to strengthen existing programmes both virtually and in person. This chapter details the key events and activities that shaped the ECB's environmental agenda throughout the year.
In February the ECB unveiled a new intranet page dedicated to enhancing awareness and visibility of its EMS. This stable resource offers comprehensive information on the ECB’s EMS, including the methodologies applied and links to relevant documents. The page serves as a valuable tool to help staff to understand the interlinkages between EMAS, the ECB’s environmental commitments and the activities it carries out in order to fulfil them.
March saw the ECB's inaugural participation in the United Nation’s World Water Day. The event emphasised the benefits of high-quality local tap water and included an interactive activity where staff exchanged water saving tips. In collaboration with library staff, a curated collection of books, articles and podcasts on the topic of water was made available. Later in the month, the ECB participated for the 13th consecutive year in the World Wildlife Fund’s Earth Hour by switching off non-essential lights for 60 minutes to raise awareness about climate challenges and promote a sustainable future for our planet.
In May the ECB introduced a Sustainable Travel Guideline, offering practical advice on eco-friendly travel, from transport choices to accommodation options. This tool aimed to raise awareness about the significant share of business travel-related emissions in the ECB’s operational carbon footprint. To learn more about the Sustainable Travel Guideline, see Chapter 6.9 – Travel.
The ECB also celebrated Biodiversity Week in May for the third time, with a series of engaging activities to raise awareness, highlight existing threats and challenges, and promote eco-friendly practices among the organisation’s staff to support its biodiversity objectives. During this week-long event, a variety of activities were offered. Staff were once again invited to participate in the popular guided tours of the garden at the main building to learn more about the biodiversity measures being implemented on the ECB’s premises. A biodiversity quiz was launched to help staff understand their individual impact on biodiversity. A presentation on coral restoration in the Maldives was organised by a staff-led interest group on environmental matters. The highlight of the week was a lecture entitled “Business Needs Nature” given by experts from the Senckenberg Society for Nature Research in Frankfurt am Main, followed by a panel discussion on the interlinkage between biodiversity, economies and business. The library staff also contributed by assembling a collection of resources on biodiversity. Additional seating was installed in the garden to encourage staff to spend more time outdoors and to provide more opportunities to engage with biodiversity on-site.
The ECB marked Earth Overshoot Day in July, raising awareness of the day when humanity’s demands on nature exceed the Earth's capacity to regenerate those resources within a year. An informative intranet article was published, explaining the significance of Earth Overshoot Day, the calculation process as well as comparisons across countries and historical trends. The article also offered practical tips on how individuals can contribute to making a global shift towards sustainability.
In August the ECB offered guidance on sustainable living via the intranet. The article provided tips and public funding opportunities for making homes more energy-efficient and eco-friendly, prompting staff to adopt more sustainable practices in their personal lives.
The e-learning course on Climate Change and Environmental Management once again proved popular with ECB staff, with more than 2,200 members having participated since its launch in early 2022. Since January 2024 the e-learning course has officially been integrated into the mandatory ECB newcomers’ onboarding programme, providing exposure to the ECB’s EMS from their first days and weeks at the bank.
In the last quarter of 2024 communication and awareness-raising activities focused heavily on Europe-wide campaigns. The ECB continued its regular participation in European Mobility Week in September, based around the theme “Shared Public Spaces”. Bicycle safety inspections were once again organised by the Biking Section and the Safety team and a presentation and discussion took place on the future of city design, with a focus on reducing car dependency. This was followed by the European Week for Waste Reduction in early November, during which the ECB engaged staff with interactive quizzes and information stands in canteen areas, based on the theme “Food Waste is Out of Taste”. These events, organised by the European Commission, underscored the importance of collective action to achieve the significant changes needed to effectively combat climate change and reduce environmental degradation.
In November the ECB took part in the organisation of the Interinstitutional EMAS Days. During this four-day event, various EMAS-registered EU institutions came together to host a series of thematic panel discussions. These discussions covered a broad spectrum of topics, including sustainable conferences and events at EU institutions, as well as sustainable mobility and many other subjects. The ECB contributed with a presentation entitled “Species Conservation and Fostering Biodiversity in an Urban Setting”. In a collaboration with the European Court of Auditors (ECA) and the European Commission’s Office for Infrastructure and Logistics in Brussels, the institutions shared insights into their urban garden concepts and biodiversity initiatives. The session highlighted maintenance practices that enhance biodiversity, such as creating dry biotopes and using wildflowers and deadwood to support insect hibernation.
Interinstitutional collaboration, whether with other European institutions or Eurosystem NCBs, is vital for the development of the ECB’s EMS. These interactions focus on sharing best practices and environmental management expertise. Collaboration is mainly facilitated through two networks: the ENCB, which serves as a platform for teams working on environmental management topics across European central banks, and the Interinstitutional Group for Environmental Management, which encourages cooperation among EMAS-registered European institutions. Notably, the ENCB has intensified collaboration within its network by launching two task forces: one focused on business travel and the other on carbon footprint calculations. Additionally, the ECB engages with peer institutions on an ad hoc basis, further enhancing its ability to expand its knowledge and implement best practices.
The network of Environmental Representatives (ERs) plays a crucial role in maintaining and developing the ECB’s EMS. As ambassadors of the EMS, ERs are instrumental in raising awareness about environmental issues within their respective business areas. They serve as the main point of contact between their business areas and the environmental management team. In 2024 ERs organised various communication and awareness-raising activities tailored to their business areas. These activities often combined team-building exercises with environmentally relevant topics, such as visits to zero-waste shops or community clean-ups.
Through these different activities and initiatives, the ECB continued to demonstrate its commitment to environmental sustainability. The institution fosters a culture of awareness and engagement among its staff, strengthening its position in environmental management within the Eurosystem and among European institutions.
In the previous chapters, objectives and measures as well as the development of the most significant environmental aspects identified by the ECB were presented. In this chapter, additional insights and information will be provided in line with the requirements of the EMAS Regulation.
Number of workplaces |
2022 |
2023 |
2024 |
|---|---|---|---|
Main building |
2,993 |
3,064 |
3,051 |
City centre buildings |
2,356 |
2,443 |
2,404 |
Total |
5,349 |
5,507 |
5,455 |
Source: ECB.
Notes: Workplace indicators are reported as a requirement for EMAS. It should be noted that a slight bias exists compared with pre-pandemic years owing to the updated teleworking policies. Not all workplaces are occupied on a day-to-day basis. Thus, workplace indicators do not fully represent actual developments.
7.1 Updates to conversion factors
The following table shows an overview of percentual changes of CO2e emission conversion factors which have been used for the calculation of the 2023 and 2024 emissions. Additional information can be found in Chapter 5 – The ECB’s carbon footprint. Although most emission factors are updated annually, only those factors that have changed by more than 5% compared with 2023 are listed in the table. The aim of the table is to highlight underlying changes in emission factors to improve the measurement of the carbon footprint.
Conversion factor updated |
Source |
Change 2023-24 |
|---|---|---|
Energy – Emissions scope 2 | ||
Biogas |
2024 Guidelines – DEFRA Greenhouse Gas Conversion Factors for Company Reporting |
-39.5% |
Energy – Emissions scope 3 | ||
Biogas |
2024 Guidelines – DEFRA Greenhouse Gas Conversion Factors for Company Reporting |
-59.8% |
Business travel – Emissions scope 3 | ||
Medium car (battery electric vehicle) |
2024 Guidelines – DEFRA Greenhouse Gas Conversion Factors for Company Reporting |
-12.2% |
Medium car (hybrid) |
5.4% |
|
Business travel – WTT[20] emissions | ||
WTT medium car (battery electric vehicle) |
2024 Guidelines – DEFRA Greenhouse Gas Conversion Factors for Company Reporting |
-12.4% |
WTT medium car (hybrid) |
5.9% |
|
Waste – Emissions | ||
Aluminium cans and foil |
2024 Guidelines – DEFRA Greenhouse Gas Conversion Factors for Company Reporting |
-69.9% |
Batteries |
||
Commercial and industrial waste |
||
Construction: tyres |
||
Construction: wood |
||
Glass |
||
Household residual waste |
||
Paper and board |
||
Plastics (combustion) |
||
Plastics (open-loop) |
||
WEEE mixed |
||
Location-based emissions
Conversion factor updated |
Source |
Change 2023-24 |
CO2e emissions 2024 – ECB’s premises (tonnes) |
|---|---|---|---|
Electricity mix, Germany (including upstream emissions) |
GEMIS database, version 5.1.0 |
n/a |
10,967.5 |
District heating mix, Germany |
GEMIS database, version 5.1.0 |
n/a |
2,327.86 |
Note: If the standards for calculating the ECB’s organisational footprint were to allow only location-based emissions, the 2024 footprint would increase by approximately 42%.
Workplace-based environmental performance indicators 2022-24
Energy consumption |
Performance indicators per workplace (kWh/workplace/year) |
2022 |
2023 |
2024 |
|---|---|---|---|---|
ECB total |
Electrical energy per workplace |
5,673* |
5,272* |
5,526 |
Heating and cooling energy per workplace |
3,761 |
3,286 |
3,634 |
|
Total energy premises per workplace |
9,434* |
8,558* |
9,169 |
|
Main building |
Electrical energy per workplace |
6,232 |
5,750 |
5,963 |
Heating and cooling energy per workplace |
2,380 |
2,040 |
2,224 |
|
Process energy per workplace |
31.4 |
72.4 |
76.9 |
|
City centre buildings |
Electrical energy per workplace |
4,963* |
4,673* |
4,972 |
Heating and cooling energy per workplace |
5,515 |
4,848 |
5,442 |
Notes: *The electrical energy per workplace indicator for the city centre buildings changed from 4,956 kWh/workplace/year to 4,963 kWh/workplace/year in 2022 and from 4,726 kWh/workplace/year to 4,673 kWh/workplace/year in 2023. Consequently, the electrical energy per workplace for the ECB total changed from 5,670 kWh/workplace/year to 5,673 kWh/workplace/year in 2022 and from 5,296 kWh/workplace/year to 5,272 kWh/workplace/year in 2023. The total energy premises per workplace energy indicator for the ECB total changed from 9,431 kWh/workplace/year to 9,434 kWh/workplace/year in 2022 and from 8,581 kWh/workplace/year to 8,558 kWh/workplace/year in 2023.
Office paper consumption |
Performance indicators per workplace (sheets of A4 equivalent/workplace/year) |
2022 |
2023 |
2024 |
|---|---|---|---|---|
ECB total |
Office paper per workplace |
213 |
1,966 |
568 |
Note: Consumption of other paper products, such as letterheads, calendars and notepads, is included.
Water consumption |
Performance indicators per workplace (m3/workplace/year) |
2022 |
2023 |
2024 |
|---|---|---|---|---|
ECB total |
Total fresh water per workplace |
11.1 |
11.1 |
14.3 |
Main building |
Non-technical fresh water per workplace (sanitary facilities, kitchenettes, canteen) |
6.6 |
6.7 |
8.4 |
Total fresh water per workplace |
9.9 |
8.2 |
9.9 |
|
City centre buildings |
Non-technical fresh water per workplace (sanitary facilities, kitchenettes, canteen) |
9.1 |
12.1* |
16.3 |
Total fresh water per workplace |
12.7 |
14.7 |
19.9 |
Note: *The non-technical fresh water per workplace (sanitary facilities, kitchenettes, canteen) indicator for 2023 changed from 11.6 m3 to 12.1 m3.
Waste generation |
Performance indicators per workplace [kg/workplace/year] |
2022 |
2023 |
2024 |
|---|---|---|---|---|
ECB total |
Non-hazardous waste per workplace |
88.6 |
98.2 |
99.2 |
Hazardous waste per workplace |
10.8 |
3.0 |
4.8 |
|
Main building |
Paper and cardboard waste per workplace |
15.0 |
13.3 |
14.3 |
Confidential paper waste per workplace |
7.7 |
6.0 |
8.5 |
|
Residual waste per workplace |
15.5 |
11.4 |
15.8 |
|
Packaging waste per workplace |
1.4 |
2.3 |
2.3 |
|
Organic waste (including grease separator waste) per workplace |
43.6 |
44.0 |
46.1 |
|
City centre buildings |
Paper and cardboard waste per workplace |
6.6 |
6.2 |
4.9 |
Confidential paper waste per workplace |
5.0 |
4.2 |
3.7 |
|
Residual waste per workplace |
12.9 |
22.0 |
11.4 |
|
Packaging waste per workplace |
4.6 |
6.9 |
3.2 |
|
Organic waste (including grease separator waste) per workplace |
54.2 |
72.7 |
77.2 |
Emissions of CO2 equivalents |
Performance indicators per workplace [kgCO2 equivalent/workplace/year] |
2022 |
2023 |
2024 |
|---|---|---|---|---|
Direct emissions – scope 1 |
Direct emissions – scope 1 |
47.4 |
38.9 |
24.3 |
Fuels |
25.4 |
21.6 |
17.0 |
|
Cooling agent losses at ECB premises |
22.0 |
17.2 |
7.3 |
|
Indirect emissions – scope 2 |
Indirect emissions – scope 2 |
450.9 |
420.7 |
480.8 |
Electrical energy consumption at ECB premises |
n/a |
n/a |
n/a |
|
Heating and cooling of ECB premises |
450.1 |
420.0 |
480.3 |
|
Biogas |
0.796 |
0.717 |
0.455 |
|
Indirect emissions – scope 3 |
Indirect emissions – scope 3 |
2,621.5* |
4,168.6* |
4,661 |
Business travel |
659.3 |
1,585.5 |
1,674.5 |
|
Staff commuting and teleworking |
330.0 |
308.1 |
345.3 |
|
Building construction amortisation |
833.2 |
809.3 |
817.1 |
|
Upstream energy |
120.9* |
119.1* |
70.5 |
|
Conference participants travel |
220.6 |
802.4* |
760.7 |
|
Waste |
1.7 |
1.6 |
1.0 |
|
Purchased goods and services |
236.3* |
323.6* |
284.1 |
|
Other assets (furniture, IT devices) |
219.4 |
219.1 |
203.1 |
|
Total CO2e emissions per workplace |
Total CO2e emissions per workplace |
3,120* |
4,628* |
4,661 |
Outside of scope emissions |
Biogas |
414.3 |
375.5 |
393.9 |
Compensated paper |
5.5 |
3.5 |
0.2 |
Notes: *Total indirect scope 3 emissions per workplace in 2022 changed from 2,618.1 kg to 2,621.5 kg of CO2e emissions. This is the result of a change of emissions from upstream energy from 119.9 kg to 120.9 kg of CO2e emissions and a change in emissions from purchased goods and services from 234 kg to 236.3 kg of CO2e emissions in 2022. Consequently, total CO2e emissions per workplace increased from 3,116 kg to 3,120 kg of CO2e emissions in 2022. In 2023 total indirect scope 3 emissions per workplace increased from 4,105.8 kg to 4,168.6 kg of CO2e emissions. This is the result of a change in upstream energy from 118.1 kg to 119.1 kg of CO2e emissions, an increase of CO2e emissions stemming from conference participants’ travel from 742.9 kg to 802.4 kg and an increase in CO2e emissions from purchased goods and services from 321 kg to 323.6 kg. This resulted in an increase in total CO2e emissions per workplace from 4,565 kg to 4,628 kg of CO2e emissions in 2023.
Air emissions |
Performance indicators per workplace (kg/workplace/year) |
2022 |
2023 |
2024 |
|---|---|---|---|---|
Air emissions |
SO2 per workplace |
0.003 |
0.003 |
0.003 |
NOx per workplace |
0.131 |
0.123 |
0.121 |
|
PM per workplace |
0.013 |
0.012 |
0.012 |
Air emissions |
Total air emissions (tonnes) |
2022 |
2023 |
2024 |
|---|---|---|---|---|
Air emissions |
SO2 |
0.02 |
0.02 |
0.02 |
NOx |
0.70 |
0.68 |
0.66 |
|
PM |
0.07 |
0.07 |
0.07 |
Biodiversity |
Land use (ha) |
2022 |
2023 |
2024 |
|---|---|---|---|---|
Land use – main building |
Total land use |
11.9 |
11.9 |
11.9 |
Sealed area |
4.6 |
4.6 |
4.6 |
|
Unsealed area |
7.3 |
7.3 |
7.3 |
|
Nature-oriented area |
6.5 |
6.5 |
6.5 |
|
Land use – city centre buildings |
Total land use |
0.7 |
0.7 |
0.7 |
Sealed area |
0.5 |
0.5 |
0.5 |
|
Nature-oriented area |
0.2 |
0.2 |
0.2 |
Uncertainty assessment of the ECB’s carbon footprint 2024
Category |
Scope |
Details |
Certainty ranking |
Comments |
|---|---|---|---|---|
Energy |
1 |
Cooling agent losses |
Good |
data: good (amount of refill); |
1, 3 |
Car fleet |
Very good |
data: very good (internal reports); |
|
1, 3 |
Emergency unit |
Good |
data: good (amount of refill); |
|
2, 3 |
Biogas |
Very good |
data: very good (meter readings/invoice, certificate); factor: very good (DEFRA) |
|
2, 3 |
District heating |
Very good |
data: very good (meter readings/invoice); factor: very good (Mainova) |
|
2, 3 |
Electricity from renewable – wind |
Very good |
data: very good (meter readings/invoice, certificate); factor: very good (GEMIS) |
|
2, 3 |
Electricity from renewable – hydropower |
Very good |
data: very good (meter readings/invoice, certificate); factor: very good (GEMIS) |
|
Business travel |
3 |
Airplane with RFI and WTT |
Good |
data: good (travel agency); factor: very good (DEFRA) |
3 |
Train |
Good |
data: fair (travel agency and estimates, rail service provider); factor: very good (TREMOD) |
|
3 |
Car personal |
Good |
data: good (internal reports); |
|
3 |
Hotel stays |
Good |
data: good (travel agency, no data available concerning the hotel category); factor: good (DEFRA; averages based on DEFRA) |
|
Staff commuting |
3 |
Teleworking |
Fair |
data: fair (survey and extrapolation); |
3 |
Staff commuting |
Fair |
data: fair (survey and extrapolation); factors: good (general factors from DEFRA, TREMOD) |
|
Conference participants |
3 |
Conference participants’ tr avel |
Fair |
data: fair (internal reports, estimates); |
Building construction amortisation |
3 |
Fixed assets – building construction |
Fair |
data: good (square metres), |
Waste |
3 |
Waste |
Fair |
data: fair (internal reports/invoices, estimates); factor: good (DEFRA, extrapolation based on DEFRA) |
Purchased goods and services |
3 |
Catering services |
Good |
data: good (catering agencies – uncertainties cannot be excluded); factor: good (IFEU: Klimatarier) |
3 |
Gardening |
Good |
data: good (amount of diesel used); |
|
3 |
Fresh and waste water |
Good |
data: good (meter readings and calculations); factor: very good (GEMIS) |
|
3 |
Office supplies and stationery |
Fair |
data: fair (costs); |
|
3 |
Cleaning services |
Fair |
data: fair (costs), |
|
3 |
Office paper, paper for publication, and other paper products |
Fair |
data: good (weight or service provider, minor data gaps cannot be excluded); factor: fair (not specific, IFEU) |
|
3 |
Electricity external printing centre |
Fair |
data: fair (reports and estimates); |
|
3 |
ICT Services – videoconferences |
Fair |
data: good (reports from service providers); factor: fair (Ökoinstitut) |
|
3 |
Electricity from external data centre |
Very good |
data: very good (meter reading, certificate); factor: very good (GEMIS) |
|
3 |
Emergency unit from external data centre |
Very good |
data: very good ECB’s share of total data centre consumption (meter reading, certificate); factor: very good (GEMIS) |
|
3 |
Fresh and waste water from external data centre |
Very good |
data: very good (ECB’s share of total data centre consumption meter reading, certificate); factor: very good (GEMIS) |
|
3 |
Cooling agent losses from external data centre |
data: good (ECB’s share of total data centre consumption); factor: very good (DEFRA) |
||
Other assets (furniture, IT devices) |
3 |
Furniture |
Fair |
data: good (internal reports, general furniture categories); factor: fair (ADEME, factors not specific to the furniture type) |
3 |
IT devices |
Fair |
data: good (internal reports, general IT device categories); factor: fair (ADEME, UBA, factors not specific to all devices) |
Note: Changes to the previous certainty ranking are marked in bold.
GEMIS = Global Emission Model for Integrated Systems; DEFRA = Department of Environment, Food and Rural Affairs; TREMOD = Transport Emission Model; UBA = German Federal Environment Agency; ADEME = French Environmental and Energy Management Agency; IFEU = German Institute for Energy and Environmental Research.
The following ranking was applied to estimate the uncertainty of the activity data and the emission factors.
Certainty ranking |
Uncertainty of activity data |
Uncertainty of emission factor |
|---|---|---|
Poor |
Activity data are rough estimates, e.g. based on studies or comparable baseline situations. |
Emission factors have been determined in a first step, but are still very general, e.g. the emission factor is extrapolated from another factor for a similar process. |
Fair |
Activity data are available but incomplete; for example, activity data are not available for the whole assessment period and are extrapolated. Evidence for the activity data is incomplete and/or not reliable. Only the costs of the data can be provided. |
Emission factors are available, but they are not yet specific and robust. Emission factors are value-based, e.g. kgCO2e/euro. |
Good |
Activity data are complete and plausible, evidence is available. Minor uncertainties/data gaps cannot be excluded/avoided but do not have a significant negative impact on the result. The share of assumptions, estimates and calculations is reduced to a minimum, they are comprehensible and plausible and have no significant negative impact on the result. |
Emission factors are specific and robust. Final, minor uncertainties cannot be excluded/avoided. Use of averages or calculations based on ADEME, DEFRA/ DESNZ, UBA or GEMIS or other non-German databases. |
Very Good |
Data are complete and plausible, evidence is available, e.g. meter readings or accurate measurements. Uncertainties/data gaps can be excluded. No assumptions or estimations are made. |
All emission factors are specific and reliable, e.g. use of provider-specific emission factors or widely known/recognised databases such as ADEME, DEFRA/ DESNZ, UBA, GEMIS or other German databases. |
Note: ADEME = French Environmental and Energy Management Agency; DEFRA = Department of Environment, Food and Rural Affairs; DESNZ = Department for Energy Security and Net Zero; UBA = German Federal Environment Agency; GEMIS = Global Emission Model for Integrated Systems.
7.2 Compliance obligations
The ECB is subject to a large number of German environmental regulations that are anchored in ordinances at both the national and the municipal level. Compliance with these regulations is ensured by a register which is managed by legal professionals at the ECB and regularly reviewed and updated. Changes and necessary measures are carefully monitored to ensure full compliance. A significant proportion of the legal requirements relate to the operation and maintenance of the ECB’s premises and external services such as cleaning and catering. The annual internal environmental verifications serve to comprehensively review compliance with these regulations. The latest assessments found no instances of non-compliance.
Table 3
Relevant areas of environmental legislation and related facilities/activities
Most relevant area of environmental legislation |
Relevant facilities/activities |
|---|---|
Water regulations |
Storage of diesel, storage of cleaning agents, use of oil traps, cooling, waste water discharge into sewerage system |
Regulations on climate protection and refrigerants |
Cooling installations containing coolants characterised by more than 5 tonnes of global warming potential expressed in tonnes of CO2 equivalent |
Regulations on energy efficiency of buildings |
Energy certification, building insulation, energy-efficient technologies |
Energy efficiency regulations |
Energy audit requirements fulfilled by EMAS |
Regulations on health and safety and hazardous materials |
Risk assessment, fire prevention, requirements for use of hazardous substances (e.g. acids, lye) |
Waste regulations |
Separation/recycling/disposal of various types of waste |
In addition to its legal obligations related to the environment, the ECB has other environmental commitments. These include adherence to the sustainable procurement guidelines and the targets set out in the EMP. Moreover, the ECB organises various awareness-raising events each year to promote staff engagement with environmental topics.
In 2022 the ECB implemented an internal framework to support the integration of the objectives of the European Climate Law into its policies, projects and activities. The progress achieved in this area was reported in the ECB’s Annual Report. In 2023 this framework was further refined, particularly in terms of incorporating environmental considerations into the ECB’s internal projects. In 2024 the ECB published its Climate and nature plan 2024-2025 to expand its work in the field of climate change. The plan, which serves as a self-imposed obligation, focuses on the three topics: the implications of the green transition, the physical impact of climate change and the risk that nature loss and degradation pose to the economy.
More information about the climate-related activities within the ECB’s mandate is available on the ECB’s website.
For any enquiries concerning information in this publication, please refer to the ECB’s contact page.
The environmental verifier named below confirms that the European Central Bank (ECB) premises at Sonnemannstrasse 20, 60314 Frankfurt am Main, Germany (main building), Taunustor 2, 60311 Frankfurt am Main, Germany (Japan Center) and Kaiserstrasse 29, 60311 Frankfurt am Main, Germany (Eurotower), as described in this Environmental Statement by the ECB with the registration number
D-125-00045, meet all the requirements of Regulation (EC) No1221/2009 of the European Parliament and of the Council of 25 November 2009, as amended on 28 August 2017 and 19 December 2018, on the voluntary participation by organisations in a Community eco-management and audit scheme (EMAS).
By signing this declaration, it is confirmed that:
- the assessment and validation have been carried out in full compliance with the requirements of Regulation (EC) No 1221/2009 as amended by Commission Regulation (EU) 2017/1505 and (EU) 2018/2026;
- the result of the assessment and validation confirms that there is no evidence of non-compliance with applicable environmental legislation;
- the data and information in this Environmental Statement provide a reliable, credible and accurate picture of all the organisation's activities.
This declaration cannot be equated with EMAS registration. EMAS registration can only be carried out by a competent body in accordance with Regulation (EC) No 1221/2009. This declaration may not be used as a stand-alone piece of public communication.
Frankfurt am Main, 25.06.2025
|
Prof. Dr.-Ing. Jan Uwe Lieback Environmental verifier - DE-V-0026 |
GUT Certifizierungsgesellschaft für Managementsysteme mbH Umweltgutachter DE-V-0213 Eichenstraße 3 b D-12435 Berlin Tel: +49 30 233 2021-0 Fax: +49 30 233 2021-39 E-Mail: info@gut-cert.de |

|
Brane Papler Environmental verifier - DE-V-0425 |
GUT Certifizierungsgesellschaft für Managementsysteme mbH Umweltgutachter DE-V-0213 Eichenstraße 3 b D-12435 Berlin Tel: +49 30 233 2021-0 Fax: +49 30 233 2021-39 E-Mail: info@gut-cert.de |

|
Disclaimer This Environmental Statement provides information to the general public and other interested parties about the environmental performance and activities of the European Central Bank (ECB) in 2022. It can be found on the ECB’s website (see the page entitled “Environmental protection at the ECB”). The ECB was first validated under the EU Eco-Management and Audit Scheme (EMAS) in 2010. This Environmental Statement, which is the 15th to be produced within the EMAS validation cycle, is a follow-up to the consolidated Environmental Statement for 2022. It is only complete when read together with this publication and contains updated data for the year 2023. This Environmental Statement was drafted in line with EMAS standards in accordance with Regulation (EC) No 1221/2009 and the updated annexes of the EMAS Regulation in accordance with Regulation (EC) No 2017/1505. |

© European Central Bank, 2025
Postal address 60640 Frankfurt am Main, Germany
Telephone +49 69 1344 0
Website www.ecb.europa.eu
All rights reserved. Reproduction for educational and non-commercial purposes is permitted provided that the source is acknowledged.
For specific terminology please refer to the ECB glossary (available in English only).
PDF ISBN 978-92-899-7400-4, ISSN 2811-695X, doi:10.2866/5682296, QB-01-25-174-EN-N
HTML ISBN 978-92-899-7399-1, ISSN 2811-695X, doi:10.2866/7484793, QB-01-25-174-EN-Q
Legal Disclaimer:
EIN Presswire provides this news content "as is" without warranty of any kind. We do not accept any responsibility or liability for the accuracy, content, images, videos, licenses, completeness, legality, or reliability of the information contained in this article. If you have any complaints or copyright issues related to this article, kindly contact the author above.
